
This lab involves determining the current expansion rate of the Universe, and then a little investigation of whether this has changed over time.
The Universe is filled with huge clusters of stars called galaxies with big nearly empty spaces in between. Our Sun is an ordinary star in an ordinary galaxy. Looking through a telescope we see sharp points of light which are stars in our own galaxy and other galaxies as faint "smudges" - they are too far away for us to see their individual stars.
Light exists in a range of color. Turns out that light is "waves" traveling through space. The color of a given ray of light is related to the distance between two consecutive peaks (or troughs) in the "wavetrain" - we call this distance the "wavelength". We call the range of wavelengths the "spectrum" of light ranging from short wavelength blue light to long wavelength red light.
Hot material in objects (stars for instance) emits light preferentially at a fixed set of wavelengths. If the object is moving towards us or away from us the wavetrain gets squashed or stretched as it is being emitted. So the ray of light we receive has a shorter or longer wavelength than it would have done if the object was stationary. Click on the image below to see an animation which illustrates this.
The spectrum of light from a galaxy is just the sum of the light from a bunch of stars - the same preferential wavelengths show up in the spectrum. In the early 1900's the spectrum of light from a bunch of galaxies was measured - strangely they nearly all seemed to be redshifted. Nobody understood this though - at that time it was not even generally agreed that the smudges of light seen through telescopes were further away than the stars!
To measure how far away an object is we normally compare it's apparent size to the known size of that type of object. We do this all the time - when driving for instance. But there are two problems with this in astronomy. First most distant objects just look like a point of light even through the most powerful telescopes. Galaxies are big enough to be an exception, but they come in a huge range of sizes and types with no way to tell just from appearance which is which size.
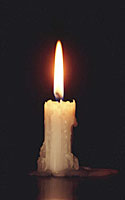
In the sequence below each image shows a candle as it would look twice as far away. Imagine that we can only measure the total amount of light coming to us from the flame in each case - the total number of yellow pixels in this example. Notice that for each doubling of the distance there about one quarter as many yellow pixels.
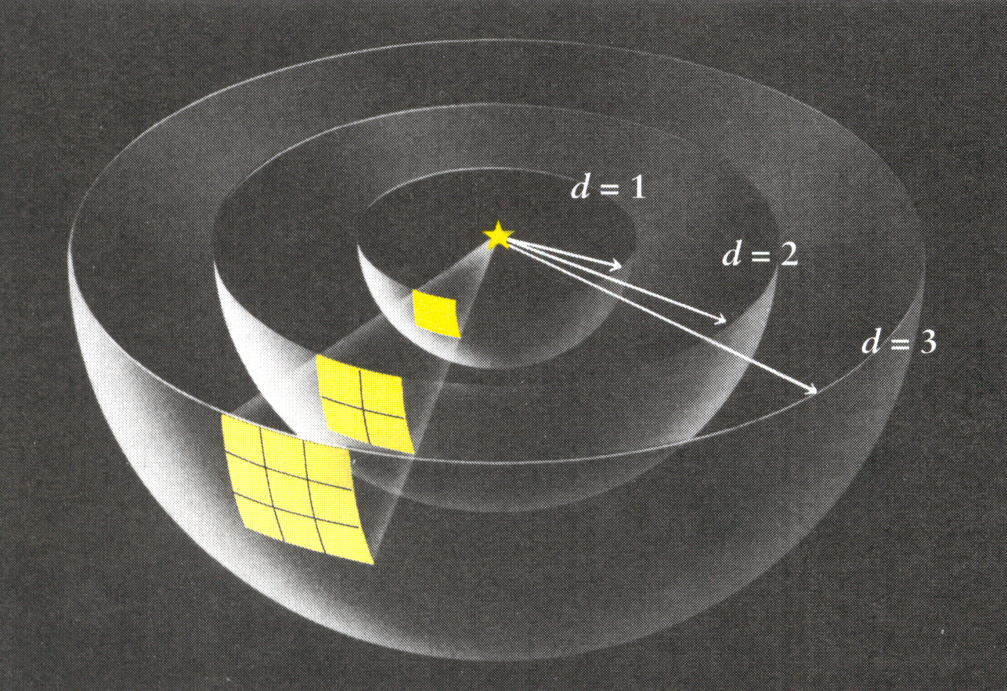
The brightness of an object gets fainter the further away it is because the light is" diluted" by spreading out onto bigger and bigger spheres around the source. The diagram below illustrates this. Since the surface area of a sphere goes up as the radius squared the brightness goes down as the radius squared - the famous "inverse square law".
So if we know the total amount of light an object is putting out, and we measure how bright it appears to be, we can easily calculate how far away it is. However, it's very hard to know how much light an object which we see far away in space is actually pumping out. We call a type of object which has a known light output a "standard candle".
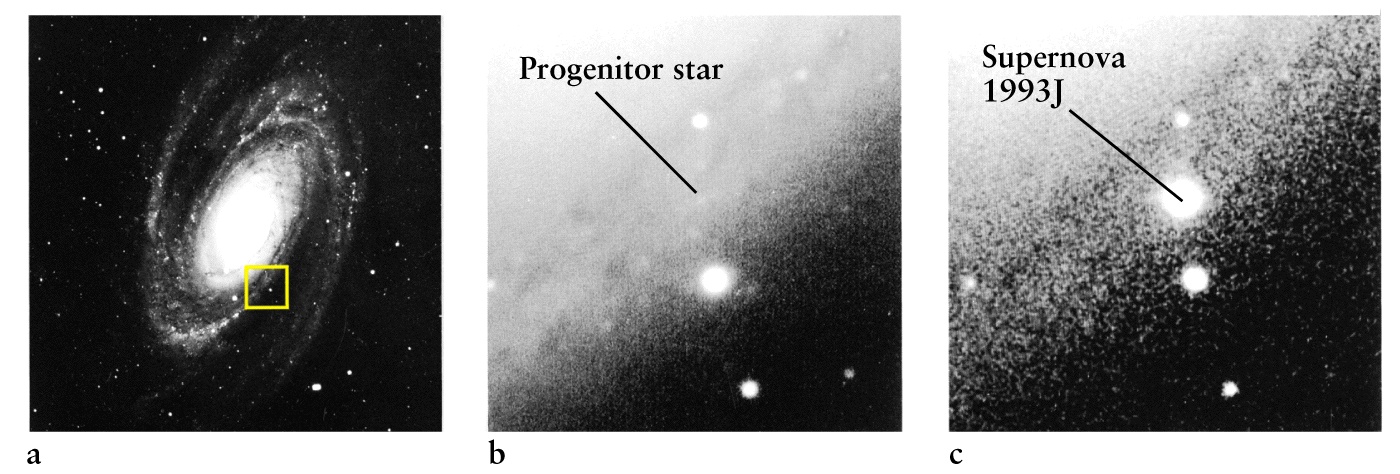
The ultimate standard candle is a type Ia supernova. These come about when a special type of star dies in a cataclysmic explosion. They have two key features: the peak light output is always the same and it is super bright. So bright in fact that they outshine their entire host galaxy for a period of a few weeks. To find them astronomers take pictures of the same region of sky repeatedly and subtract the pictures looking for something that's changed. When they find one they then measure the redshift, and track the brightness as it increases and then falls to get the peak brightness. The picture below shows a supernova in a nearby galaxy.
In this lab we are going to use some supernova data published in this research paper which came out a few years ago. Below I give the numbers from Table 2 of that paper in a form which is a little easier to understand. To measure redshift we divide the wavelength shift of the received light by the wavelength of the light as emitted. We refer to this ratio using the letter "z". The speed at which an object is moving away from us is just z times the speed of light (300,000 kilometers per second).
  redshift   brightness

    0.0140  163
    0.0180   50.7
    0.0200   89.7
    0.0260   39.5
    0.0260   32.9
    0.0300   32.6
    0.0360   22.5
    0.0430   12.6
    0.0450    9.58
    0.0500    8.04
    0.0500    8.35
    0.0520    9.41
    0.0630    5.12
    0.0710    4.67
    0.0750    4.30
    0.0790    4.85
    0.0880    1.55
    0.1010    2.13
Try to figure out how to translate the brightness numbers into distances using the inverse square law - ask your TA if you need help. Then you need to rescale the resulting distance numbers using the additional fact that the first supernova in the list was at a distance of 47 mega parsecs (million parsecs). A parsec is a special unit of distance used in astronomy equivalent to 30 trillion kilometers. Now plot a scatter graph with distance on the x-axis and velocity on the y-axis. The points should lie on a nice straight line sloping up to the right. This is telling us that the further away a supernova is the faster it is moving away from us. Considering that the supernova we are plotting are located in all directions this is a very strange result. Are we located in the most unpopular place in the Universe? Was the Universe created in a huge explosion that just happened to be located where the Earth is today?
Fit a trend-line to your graph - the slope of this line is kilometers per second per megaparsec. This number is called Hubble's constant after Edwin Hubble who first plotted such a graph and noticed the relationship in 1929. The correct interpretation of this result required a major shift in thinking for scientists at that time. It turns out that the only satisfying explanation of these facts is quite mind-bending. We have to give up the idea that the redshift of the light from faraway galaxies results from their motion through space away from us. Instead imagine that space itself is stretching and the galaxies are being carried along on this flow like boats in a tide. Click in the image below to see an animation which illustrates this.
With a little thought you should be able to see that we don't have to be in any special place for this result to be true. Astronomers in another galaxies would see the same thing - all the other galaxies moving away them. It is also easy to see that if the Universe has always been expanding then at some time in the past everything was on top of everything else and there must have been a beginning - a big bang!
It turns out that using large telescopes we can see supernova considerably further out than the ones listed above. They have been detected at redshifts beyond 1. It is a good job that we have given up on the idea of redshift being produced by motion of objects through space. Otherwise a redshift greater than 1 would imply an object moving away from us faster than the speed of light. And we know from Einstein that that is not possible. So from now on we will think in terms of the scale factor of the Universe. This is just the ratio of the emitted wavelength of the light to the received wavelength of light. If the light ray shows up stretched by a factor of two the Universe must have been half its current size when it was emitted.
The table below includes the same supernova as above plus the ones from Table 1 of the paper. The two columns give the scale factor of the Universe when the supernova went off and the brightness of the light reaching Earth when it recently got here (these events were recorded between 1992 and 1997). Calculate the "distance" to the supernova using the same rule as you used above and make a graph with distance on the x-axis and scale factor on the y-axis. You should get a curve which slopes down to the right. In general this seems OK - light that is being received now from more distant supernova has being traveling through space for longer, and thus since the Universe was smaller.
    scale   brightness     scale     brightness

    0.9862  163            0.7018    0.143
    0.9823   50.7	   0.6993    0.095
    0.9804   89.7	   0.6993    0.0570
    0.9747   32.9	   0.6897    0.0751
    0.9747   39.5	   0.6897    0.0549
    0.9709   32.6	   0.6897    0.1008
    0.9653   22.5	   0.6882    0.0549
    0.9588   12.6	   0.6859    0.0580
    0.9569    9.58	   0.6826    0.0474
    0.9524    8.35	   0.6793    0.0580
    0.9524    8.04	   0.6757    0.0666
    0.9506    9.41	   0.6711    0.0586
    0.9407    5.12	   0.6689    0.0751
    0.9337    4.67	   0.6676    0.0334
    0.9302    4.30	   0.6553    0.0559
    0.9268    4.85	   0.6452    0.0401
    0.9191    1.55	   0.6369    0.0501
    0.9083    2.13	   0.6333    0.0413
    0.8532    0.868	   0.6329    0.0420
    0.8475    0.683	   0.6325    0.0591
    0.7576    0.183	   0.6281    0.0174
    0.7386    0.113	   0.6203    0.0340
    0.7289    0.128	   0.6192    0.0539
    0.7278    0.039	   0.6177    0.0307
    0.7278    0.208	   0.6042    0.0501
    0.7257    0.094	   0.6039    0.0380
    0.7205    0.088	   0.6035    0.0299
    0.7143    0.115	   0.5672    0.0166
    0.7062    0.095	   0.5495    0.0191
    0.7042    0.097	   0.5470    0.0141
But why are the points on your last graph a curve rather than a straight line? Seems like we would expect a straight line for a Universe expanding at a constant rate. In such a Universe the scale factor is "proportional to" time - i.e. the scale factor is just some number multiplied by the elapsed time. It turns out that the sacred inverse square law of ordinary physics no longer correct in an expanding Universe. Think of the sphere of light rays expanding out from an exploding supernova. As time passes the sphere grows at a constant rate and the density of light rays on its surface is diluted as time squared. But in an expanding Universe the light rays are also stretched and loose energy. When we talk about the brightness of light we mean the amount of energy received in a given amount of time. So the brightness actually falls off closer to the cube of the scale factor - two powers for the expansion of the sphere and one power for the redshift dimming of the light.
If you modify your conversion from brightness to distance appropriately and re-plot the graph it should be close to a straight line.